The current health and economic crisis has upended the way we do work and requires organizations to go beyond everyday HR metrics to optimize costs and drive growth during and after the COVID-19 pandemic. To begin the work, start with these key workforce metrics.

The economic downturn is forcing many organizations to take quick action to manage costs. However, it’s equally important for business leaders to look beyond the short term and keep an eye to how the future can be shaped by actions taken now. As we imagine a path towards recovery, organizations must identify critical job roles that will help them navigate through uncertainty and the long-term implications of having a remote and dispersed workforce.
HR will play an important role in long-term planning. Leaders need to think beyond cost-containment exercises and consider transformational changes to the ways of working afforded by this opportunity. HR can help develop a thoughtful and targeted approach that optimizes people costs while also positioning organizations to come out of this crisis stronger. There are three areas business leaders should focus on: how work gets done, where it gets done, and what tools get the work done as shown below.
In this article, we’ll explore each of the three categories of critical HR metrics that business leaders should drill into as they balance cost containment with the future of work.
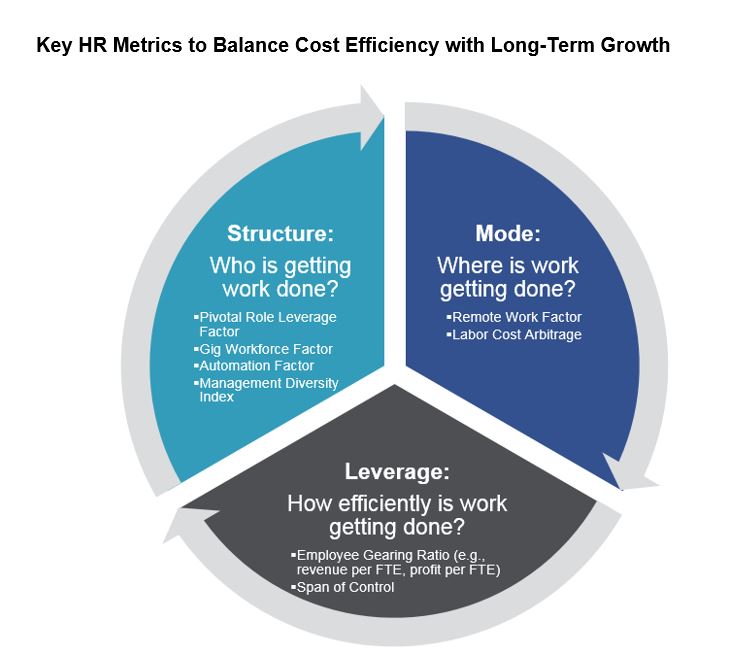
Structure: Who is Getting the Work Done?
Pivotal Role Leverage Factor: This metric is defined as pivotal role labor costs as a percent of total labor costs relative to the percent of employees in pivotal roles within your organization. It enables organizations to determine the degree to which they are enabling pivotal roles relative to non-critical roles. (For detailed definitions of metrics and formulas, please contact the authors.)
As we discussed in our white paper Managing Workforce Strategies During Times of Crisis, while many organizations will need to reduce costs during this time, they need to ensure they are cutting from their fat and not their muscle. That means organizations need to strike the right balance between pivotal roles that generate revenue and other roles that serve the core of the business. There is a spectrum of criticality of the roles in your organization and you will need a collection of roles to function as a business. Determine what that proportion looks like within your organization and if you are truly differentiating between pivotal and non-pivotal roles.
Pivotal roles (i.e., jobs that have a disproportionate impact on the firm’s key objectives) typically comprise 5% to 10% of all jobs. Given their importance, these roles are often proportionately more expensive to staff. For example, if your organization has identified 10% of roles as pivotal, the corresponding labor costs as a percent of total labor costs should exceed 10% to reflect their significance towards organizational objectives. Therefore, organizations need to look at both the percentage of pivotal roles in their organization as well as the percentage of pivotal role labor costs. People analytics can calculate the ratio of the percentage of pivotal role labor costs to the percentage of pivotal roles, which helps organizations determine if they are protecting the muscle of the business.
A higher pivotal role leverage factor indicates that they are differentiating their critical roles, while a lower leverage factor may indicate that they are not adequately distinguishing between the roles and likely applying a “one size fits all” compensation philosophy. Not all roles are created equal. During a time where organizations need to reduce costs and maintain focus on business-critical objectives, ensuring your labor costs are allocated proportionately is vital to long-term success. Through measuring the relationship of roles to revenue, core delivery and operational efficiency, HR and people analytics teams can help business leaders across functions measure the criticality of each role, their respective contributions to firm profitability, and which roles and skills are the most vital to the current and future success of the organization.
Gig Workforce Factor: The gig workforce factor is the ratio of gig workers (e.g., freelancers, contractors) to full-time employees. It helps organizations determine how they can leverage all types of work to effectively staff their workforce.
The future of work is not only going to impact the location of the workforce but also the composition. Forty-three percent of the workforce is expected to rely on gig work for some portion of their income in the U.S. by the end of 2020; that is expected to grow to 60% by 2023.[1] The increased rate of work being done remotely could accelerate this trend. With 30 million Americans relying on gig work as their primary income and 67% of full-time employees indicating interest in gig work over their current jobs, organizations need a strategy to migrate and/or replace full-time employees to gig workers.[2] HR leaders need to know what percentage of their workforce is going to become gig workers, when it will happen, and in what locations and job roles. Answers to these questions will be linked to the long-term objectives of the organization, the capabilities required to meet these objectives, and the talent availability in the market for said capabilities.
Automation Factor: The automation factor is the percent of jobs that have a more than 50% risk of being automated. It can provide insight into which tasks and roles will soon be automated and where to invest in talent versus technology.
With artificial intelligence, robotics and cognitive technologies continuing to overtake routine tasks, organizations are forced to consider which tasks are better done by humans (knowledge tasks) and which are more efficiently accomplished by machines (routine tasks). Identifying the tasks and responsibilities at risk of being automated can help HR determine which jobs may become obsolete in the future, which jobs will require skills augmentation, and which talent will have the capacity to be reskilled due to automation. Knowing where automation will supplant human activity in the future will also allow HR to develop learning programs for employees who are working on soon-to-be automated tasks. As organizations increasingly look towards automation, they will have to bear the cost of digitization and reskilling their workforce and will have to closely examine the cost of automation replacing talent.
Management Diversity Index: The management diversity index is the number of employees with diverse backgrounds in management roles divided by the total number of management employees. This metric helps determine the degree to which an organization develops and retains diverse talent among its leadership.
Culture is set at the top of an organization. While many companies point to how they value diversity, one clear measure of progress is in the diversity represented among senior management. According to the 2020 Bloomberg Gender Equality Index, as we continue to move up the corporate ladder we are seeing proportionately fewer women. Women comprise 49% of entry-level employees, 37% of middle managers, 27% of senior managers, 19% of executives, and only 6% of CEOs. [3] The lack of representation at the top is even more surprising when studies show that diverse leadership teams are 70% more likely to capture new markets, 33% more likely to generate better-than-average profits and generate 19% more revenue from innovation than organizations with below-average diversity at the leadership levels.[4]
It’s worth noting, however, that the management diversity index is an outcome of diversity and inclusion practices and behaviors. It’s up to HR and analytics teams to identify if/where there are gaps in policies and outcomes. They need to be able to answer questions such as:
- Are we attracting diverse candidates?
- Are we selecting candidates with diverse backgrounds?
- Are we assessing and growing talent with diverse backgrounds?
- Are employees with diverse background being rewarded fairly?
- Are we engaging everyone at the organization regardless of background?
The topic of diversity and inclusion is far too nuanced to provide it the attention it deserves in this article. However, as organizations continue to reimagine how work gets done and by who, they should not lose sight of looking at it through the lens of diversity and inclusion.
Mode: Where is the Work Getting Done?
Remote Work Factor: This metric is the ratio of employees that are working remotely to those working on-site. It helps determine how many employees they need on premises.
The globalization of the economy and enhanced technology tools had already enabled a remote workforce before the COVID-19 pandemic. The percentage of employees that continue to work remotely following the pandemic remains to be seen but most business leaders and economists expect the remote work factor will permanently increase for many organizations as a result. As companies roll out their return-to-workplace plans, they need to make assessments of which employees can and/or will want to continue working remotely now. These decisions will have a significant impact on real estate investment strategies over the next six to 12 months.
Key inputs into the analysis should include real estate footprint as a percent of the total workforce, the required square foot per full-time employee, and total loaded real estate divided by the total number of workers. Such metrics will enable organizations to accurately determine the remote work factor. For example, while the average square foot per employee in North America ranges from 150-175 square feet per person, technology companies typically range from 125-175 square feet per person.[5] As we move towards a more remote environment, organizations will need to factor in the upfront technology costs to support the transition.
Another factor to consider when planning for a remote workforce is the percentage of additional square feet needed within company locations per social distancing requirements. Since it may not be tenable to expand existing locations, organizations will be further motivated to identify work that can be accomplished remotely. By focusing on these inputs you’re not only saving on overhead costs for remote workers and corresponding real estate costs, but you’re also widening your talent pool for these roles. Analytics teams can evaluate the tasks, responsibilities, and required resources of the roles in your organization to determine which roles need to be onsite, which can be remote and subsequently the cost ratio of remote to non-remote employees.
Labor Cost Arbitrage: Location labor cost arbitrage is associated with the idea that certain skills or talent can be found in a different market at a lesser cost. Labor cost arbitrage is calculated as a cumulative labor cost index for an organization based on how its employees are spread across different locations. Organizations can use this metric to determine where to open a new location or hire talent based on market factors for said talent.
Depending on the size of your organization, a $1 per hour difference in wages can result in significant cost savings. With organizations struggling to reduce costs while still meeting business objectives, the ability to differentiate between high and low labor cost locations is critical. By analyzing the talent cost and quality, corporate tax rates, and real estate costs across locations, HR can help determine where to keep operations running and where to scale back to maximize the impact of any labor arbitrage decisions. For example, the average yearly cost to rent office space per employee can range from $4,194 in Atlanta to $14,800 in New York.[6] All else being equal, organizations will obviously choose to open operations in Atlanta. However, rarely is all else always equal, and organizations need to weigh the pros and cons of operating in a more expense market. A thorough analysis of cost of living, talent availability and costs, and other location factors, can help business leaders source future talent and determine a go-forward strategy.
Leverage: How Efficiently is Work Getting Done?
Employee Gearing Ratio: This metric is defined as how effectively organizations are using every dollar that is deployed on an employee. It’s calculated from a variety of key data points, including revenue per full-time employee (FTE), profit per FTE and cost per FTE.
With labor costs being the largest expense for organizations it makes sense that they should be tracking the impact of their investment in their employees. However, we caution organizations against using only the employee gearing ratio as a measure of success. For example, energy companies have an average revenue per FTE of $1.8 million compared to industrials with an average of just $0.32 million.[7] While this might sound like energy companies are more profitable, they also have a larger cost base, a huge R&D investment and expensive but key jobs roles. Therefore, it is critical to look at these metrics holistically: analyze how metrics vary by key organizational segments such as department, location or level. Due to the pandemic, many organizations are being forced to pivot and will be expected to meet the changing needs of their customers. By forecasting future opportunities in the market, not simply revenue per employee from existing business drivers, analytics teams can help their organization proactively prioritize critical segments of the organization.
Span of Control: Span of control is defined by the number of subordinates that can be managed effectively by leaders in an organization.
Organizations can use this metric to identify where bottlenecks exist within their organization or conversely if their managers are spread too thin. Like other metrics discussed, span of control will depend on the unique circumstances and business objectives of the organization, the particularities of the roles and responsibilities being discussed, and the economic environment. HR can help analyze where inefficiencies exist, whether certain job functions have supervisors doing “non-supervisory” tasks, and if there is the appropriate number of employees at each level within each function. Our survey data finds the general and administrative function span of control can range anywhere from three direct reports per manager in community banks to approximately seven direct reports per manager at the global level. Similarly, spans of control at technology firms range from two to eight depending on the function and size of the company. For this reason, analytics teams should carefully evaluate the impact of increasing or decreasing spans of control and determine if organizations can still function with wider spans or if supervisors will be spread too thin.
Creating a Lasting Impact
Now that we’ve identified the key HR metrics to navigate short-term cost savings with long-term business planning, there are two more crucial steps organizations should take to extract the most value from tracking these data points.
The first is benchmarking. This is a proven valuable process that provides organizations with a reference point if they are in line with top-performing companies. HR should be benchmarking the metrics discussed in this article both externally against similar companies (e.g., industry, location and company size) and internally against different regions where the firm operates.
The second step is creating an HR Metrics Dashboard. While a one-off analysis will provide insight, it will only be a static perspective on the state of your organization to a specific point in time. Organizations are living organisms. As they grow, their workforce composition evolves (e.g., hiring, attrition, internal mobility) over time and business strategies adapt to market demands. By the time organizations make decisions based off of these insights and changes are implemented, there is a good chance the state of your organization will have changed to the point where an updated analysis will be required. An HR Metrics Dashboard will enable your organization to track the appropriate metrics on a continual basis. By inputting the required data elements on a regular basis — we recommend quarterly or semiannually — your organization will be able to effectively monitor these metrics in a sustained manner. We recommend going beyond a one-time audit and creating a dashboard that will enable HR to proactively manage and track their people costs.
Managing people costs effectively and planning the future of the workforce is dependent on an organization’s ability to track data, turn that data into metrics, and know which metrics to prioritize given the business’ unique circumstances. However, your investment in people metrics should not stop there. Your organization can reap the benefits of tracking people metrics by augmenting it with benchmark data and sustaining it with an HR metrics dashboard. The ability to know which metrics matter most and building an ecosystem that enables you to manage your labor costs proactively and on a continuous basis will provide your organization with a competitive edge while navigating this crisis.
Aon’s Organizational Risk Scorecard and People Metrics Platform help organizations see how they compare to the market and monitor their talent metrics on an ongoing basis. The tools provide clients access to a dashboard that leverages our proprietary data to enable HR and business leaders to focus on the people metrics that will provide them with the most value.
To learn more about how these tools can help your organization, please contact one of the authors or write to rewards-solutions@aon.com.
COVID-19 Disclaimer: This document has been provided as an informational resource for Aon clients and business partners. It is intended to provide general guidance on potential exposures, and is not intended to provide medical advice or address medical concerns or specific risk circumstances. Due to the dynamic nature of infectious diseases, Aon cannot be held liable for the guidance provided. We strongly encourage visitors to seek additional safety, medical and epidemiologic information from credible sources such as the Centers for Disease Control and Prevention and World Health Organization. As regards insurance coverage questions, whether coverage applies or a policy will respond to any risk or circumstance is subject to the specific terms and conditions of the insurance policies and contracts at issue and underwriter determinations.
General Disclaimer: The information contained in this article and the statements expressed herein are of a general nature and not intended to address the circumstances of any particular individual or entity. Although we endeavor to provide accurate and timely information and use sources we consider reliable, there can be no guarantee that such information is accurate as of the date it is received or that it will continue to be accurate in the future. No one should act on such information without the appropriate professional advice after a thorough examination of the particular situation.
[1] Bureau of Labor Statistics
Related Articles