Recently The Kingdom of Saudi Arabia announced a grand economic vision to take the economy to 2030, diversifying the area’s reliance on oil. This comes at just the right time. Depressed oil prices and a tumultuous 24 months in the region, where state coffers have been tested and economic growth has lagged, has now been met with a new sense of optimism and a way forward. This has been further spurred on by the recent increase in oil prices that are back at approximately $50 USD a barrel.
This comes at just the right time. Depressed oil prices and a tumultuous 24 months in the region, where state coffers have been tested and economic growth has lagged, has now been met with a new sense of optimism and a way forward. This has been further spurred on by the recent increase in oil prices that are back at approximately $50 USD a barrel.
Strong and modern economy
A sign of a strong and modern economy is one with an advanced financial services sector that is well regulated and governed, helping to raise, attract and facilitate the flow of capital and foreign direct investment into the country. Saudi Arabia is already on course to achieve this.
Indeed the Tadawul is the largest stock exchange in the region. The country is well served by two regulatory bodies: The Saudi Arabian Monetary Agency “SAMA” and The Capital Markets Authority “CMA”, that are keen to ensure that the country has top class, well capitalised financial institutions that can serve both retail, corporate and institutional clients.
Brokerage and Investment Houses to the fore
Arguably, one of the principal areas of focus over the next few years will be the performance of the Brokerage and Investment houses regulated by the CMA. Indeed, the opening up of the Tadawul, the inclusion of Saudi Arabia in the MSCI index in 2017 and the economic vision of the Deputy Crown Prince Mohammed bin Salman, will have a profound impact on these firms and the opportunities are immense.
However, for now, firms have to navigate the present and there is certainly significant variance in performance across the industry. Based on our proprietary research, insight and analysis of the Market, performance is extremely diverse across the Authorised Persons “APs” landscape:
- Who will be in a strong enough position to invest for the future?
- Are firms deploying their resources in the most optimum way?
- Are APs paying their employees in line with best market practice?
- Are compensation philosophies in line with performance?
- To what degree are APs segregated from the Bank affiliate?
- How does the business mix affect the relative performance of one business versus another?
- Why does Return on Equity differ so much from one firm to another?
- Should firms be growing out in other business areas?
- How should cost saving and efficiencies be extracted?
- Is there alignment to go IPO?
These are all questions each firm will need to face over the coming months, within stakeholder circles and in Board of Director meetings. In this white paper we will touch on some of these aspects, and provide a lens into the issues that firms should be monitoring and reviewing in the current environment, with the hope that a golden period is just around the corner.
Varied Performance
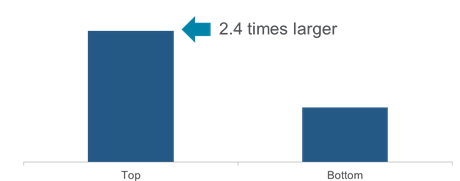
Our analysis into the industry suggests that revenue per head differs by more than 2.4 times across a spectrum of 15 APs. With the CMA recently deeming it obligatory to report top line revenue, expenses and net income, there is a wide difference in absolute performance that can be seen with the largest firms like NCB Capital producing +SAR 650m compared to the smaller firms like Saudi Hollandi Capital producing 68m.
Revenue per Head
Differential between Top Percentile vs. Bottom Percentile
However, we believe it is really the relative performance on scaled metrics that are a true test of performance – i.e. Revenue per head, Net Income per head, Cost per head and Return on Equity. It is here that we have seen a few mitigating factors across firms. At the firm-wide level, some firms are fortunate enough to have a bank affiliate on which they can lean on for IT and to some degree other corporate services support such as Human Resources and Legal to name a few, alleviating the need for own in-house headcount. Our analysis also suggests that the largest firms do not necessarily have the best relative productivity.
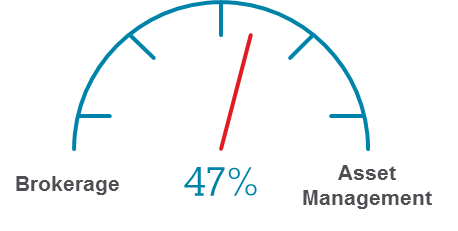
Furthermore, some firms have a business mix more heavily weighted towards Brokerage which in the current market down turn can impact the overall performance significantly. Indeed, the median revenue per head in Asset Management in the Kingdom is 47% higher than in Brokerage.
Revenue per Head Differential
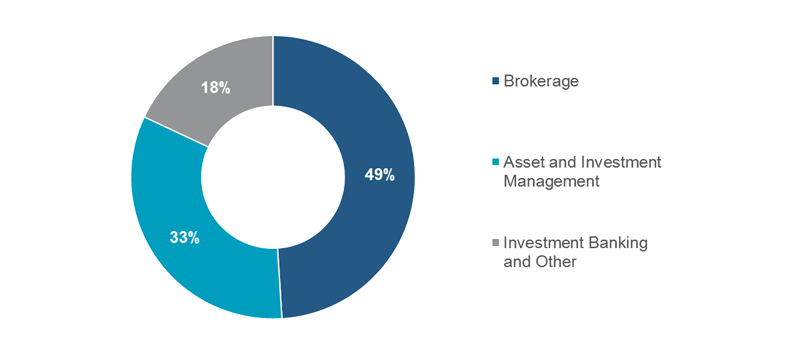
Compare this to a firm who has a business product mix more heavily weighted towards Asset Management where revenue per head can be higher and the contrast is evidently stark. Our analysis suggests that on average, 47% of headcount in the front office is in Brokerage, 37% in Asset Management and 18% in Investment Banking and other business lines.
Firms need to evaluate where they stand in this quantum, how their business mix compares to the market and affects their relative performance. Thus, the question begs – How does my firm truly compare if you do not normalize for business mix? Firms should also have a keen sense of what its strengths are – is it a large diversified behemoth across all product sets or a specialized firm in a certain business line or asset class.
A simple illustrative example below shows performance for two firms of equal size in headcount, performing at median Revenue per head in the front office across each business line, but with one firm having a heavier business mix in Brokerage versus another in Asset Management.
The example illustrates the variance in performance between the firms who are of the same size but because of a different business mix, each performs markedly differently.

Performance: Both firms perform at the median in revenue per hear in each business line. Median revenue per head in brokerage is SAR 100 and in asset management is SAR 147.
Outcome at firm-wide level:
- Firm A = 25 heads x 100 + 25 heads x 147 = 6,175 Total Revenue and 123.5 per Head
- Firm B = 15 heads x 100 + 35 heads x 147 = 6,645 Total Revenue and 133 per Head
It is imperative that firms think about this in context and how it will pan out for the next 2-3 years. We have been helping firms perform position audits versus the Market and provide context into their relative performance with an expectation to grow over the next few years. All of this needs to be juxtaposed with a clear compensation philosophy and pay for performance approach, where there is differentiation that rewards and retains a firm’s key talent at the individual level.
Efficiencies and Cost Savings – A Scalpel Rather Than An Axe
Every firm continues to look for cost savings and efficiencies from the global megabanks to the AP’s in the Kingdom. One area that is of keen interest is reviewing the relationship between front office and infrastructure spend. Clearly as a firm, you want to make the operational side of the business as lean and efficient as possible without hindering service and subjecting the business to unnecessary risks. From a regulatory standpoint, regulators are keen for firms to demonstrate that they do not have significant operational risk in place through a lack of investment in key areas such as compliance, risk management, client service etc. and so firms have to perform a delicate balancing act to ensure they get the equilibrium right and take a sharp targeted scalpel to their current platform rather than an axe that can leave needless long term damage. Again the question begs – how do you ensure right scaling?
We review firms through a number of different lenses when it comes to right scaling:
- Relative distribution of headcount between front office and infrastructure.
- Are firms deploying their resources in the most optimum way?
- Does my firm have too many infrastructure staff in relation to revenue producing front office staff? What about economies of scale? Are compensation philosophies in line with performance?
- Relative distribution of cost between front office and infrastructure.
- How do we ensure comparability for firms that outsource heads to bank affiliates. These banks will typically have heavy spend in outsourcing or service level agreement (SLA) charges.
- Relative spend on infrastructure as a proportion of revenue generated.
- What is affordability like? Is this a front office revenue production problem or a scale issue?
- Relative distribution of headcount between each function within infrastructure, a key statistic, that may illustrate an under or over investment in some functions relative to others, e.g., IT vs. Ops vs. Finance vs. Risk.
- Structural business mix within the front office.
- Is it more efficient to have a product agnostic sales team or a sales team aligned by business line? How do I incentivize these people?
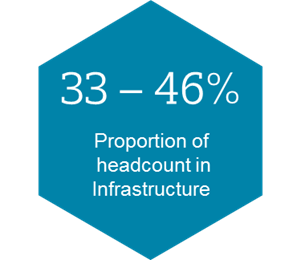
The above list is not the definite answer, nor is it exhaustive, but it should form the basis of any review into the efficiency of a business and facilitate clear surgical and substantiated decision making. Our analysis suggests that at the low end a firm has 33% of its headcount in infrastructure compared to the high end of the spectrum, where some firms have +45%. Firms should be reviewing this dynamic and trying to actively allocate resources in the best possible way.
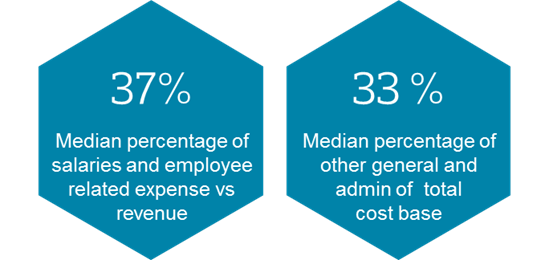
What About Other Non-People Costs?
Again, a key area to review and recognize in the context of a firm’s size, scale and relative spend. Understanding this dynamic in relation to number of employees, affordability and scale of the business can provide a lens to save costs. Current non-people costs make up 33% on average of the cost base across APs in Saudi Arabia, but effectively reviewing this on a per head basis and per item basis is imperative.
The Way Forward
The recent announcement that Saudi Arabia could debut on the international debt market with a $15bn bond sale as early as July this year is a sure sign that change is coming quickly, reflecting not only tighter government purse strings, but also a willingness to push ahead with real change and diversification away from oil based revenue. International banks are already lining up to reengage and snap up market share from local banks. This should not be seen as a threat to the local AP’s, but rather an opportunity to review their current business models, improve efficiencies and invest in growth businesses. A first step into this should see firms deploying resources in an optimum way by gauging and measuring the areas discussed at length above.
Related Articles